Projects and work across data, ML, and engineering.
Dude, Where's My Board?
A San Diego surfboard aggregator that scrapes local shops, shaper sites, and marketplaces into a normalized catalog for browsing new and used boards in one place. Built with a Next.js frontend, Python scrapers, Supabase, and LLM-assisted normalization to power search, filters, and inventory freshness.
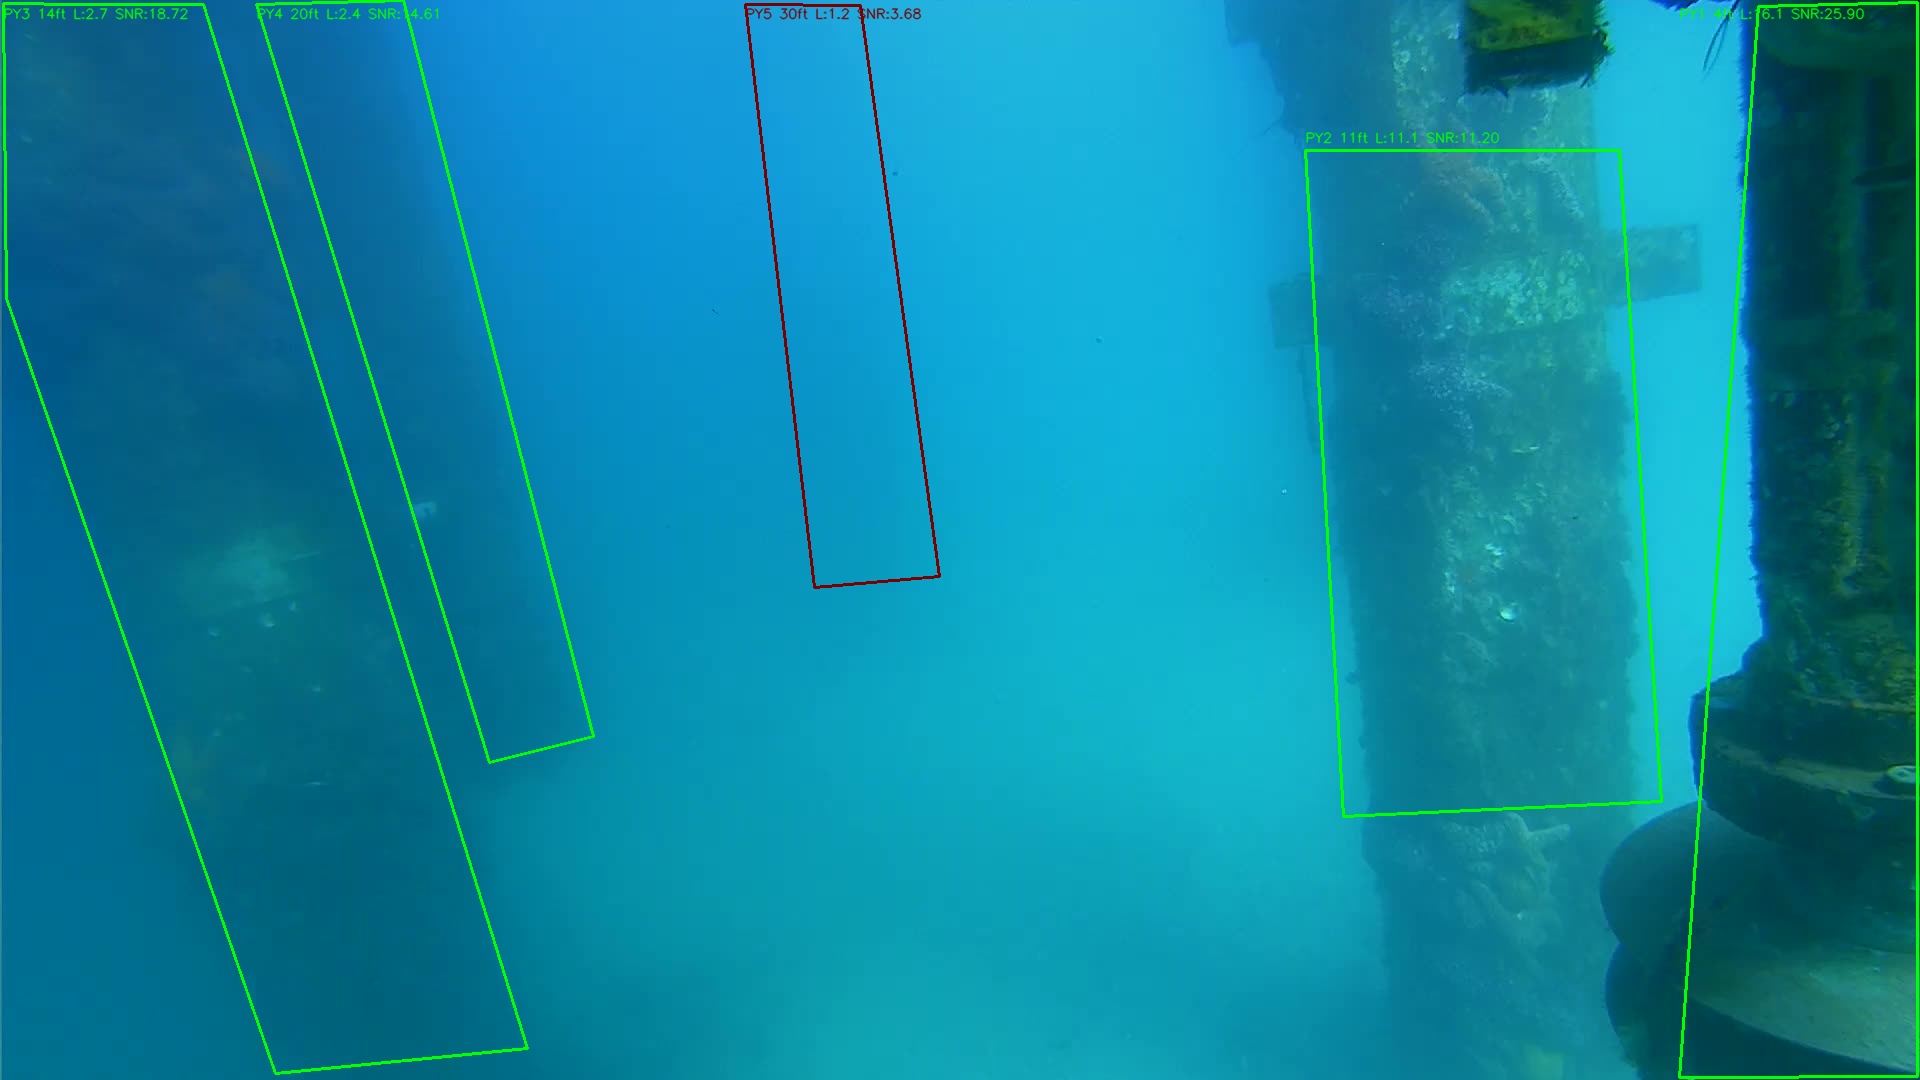
TideEye: Underwater Visibility
Vis is a full-stack computer vision application that analyzes live underwater camera footage from the Scripps Institution of Oceanography pier in La Jolla, CA to estimate horizontal visibility in real-time using a Beer-Lambert exponential attenuation model fitted across known-distance pier pylons. The system is deployed on a serverless AWS architecture (Lambda, S3, CloudFront, DynamoDB) with a React frontend, automated CI/CD via GitHub Actions, and integrates live oceanographic data from CDIP buoy stations and Open-Meteo to provide divers and researchers with continuously updated visibility forecasts.
My Personal Site
The site you are on now! Built from the ground up with HTML, CSS, and JavaScript, and hosted on GitHub Pages with Cloudflare as the CDN. Automated deployments via GitHub Actions on every push to main.
WMATA DC Metro Analysis
Developed a Websocket off the WMATA API, run in an AWS instance alongside a Javascript-based webpage for live train and bus locations. Lambda functions utilized in tandem with main site to feed route information, timings, and predicted arrivals.
Hype Words: Social Media Mining and Classification
Utilized web scraping techniques to curate live datasets of social media posts, then exploring classification techniques to understand social media sentiment around Blockchain in Healthcare. Successfully applied a transformer-based approach to text classification using BERT.
Visualizing Bird Migrations
Processing of geojson, csv, and netcdf files to showcase Swainson Hawk migration patterns.
NOAA: Waves and Buoys Scraping
Utilize Beautiful Soup to crawl NOAA API endpoints for Buoy and Wave data to then store and visualize on a web-page map via Javascript.
Regularization Techniques
An exploration of regularization techniques from Ridge to LASSO to SCAD, on Forest Fires, Boston Housing, and randomly generated datasets.
Comparing Regressors
Analysis of various regression approaches from localized kernel-based regression (LOWESS) to neural networks in their efficacy on predicting Boston Housing Prices.
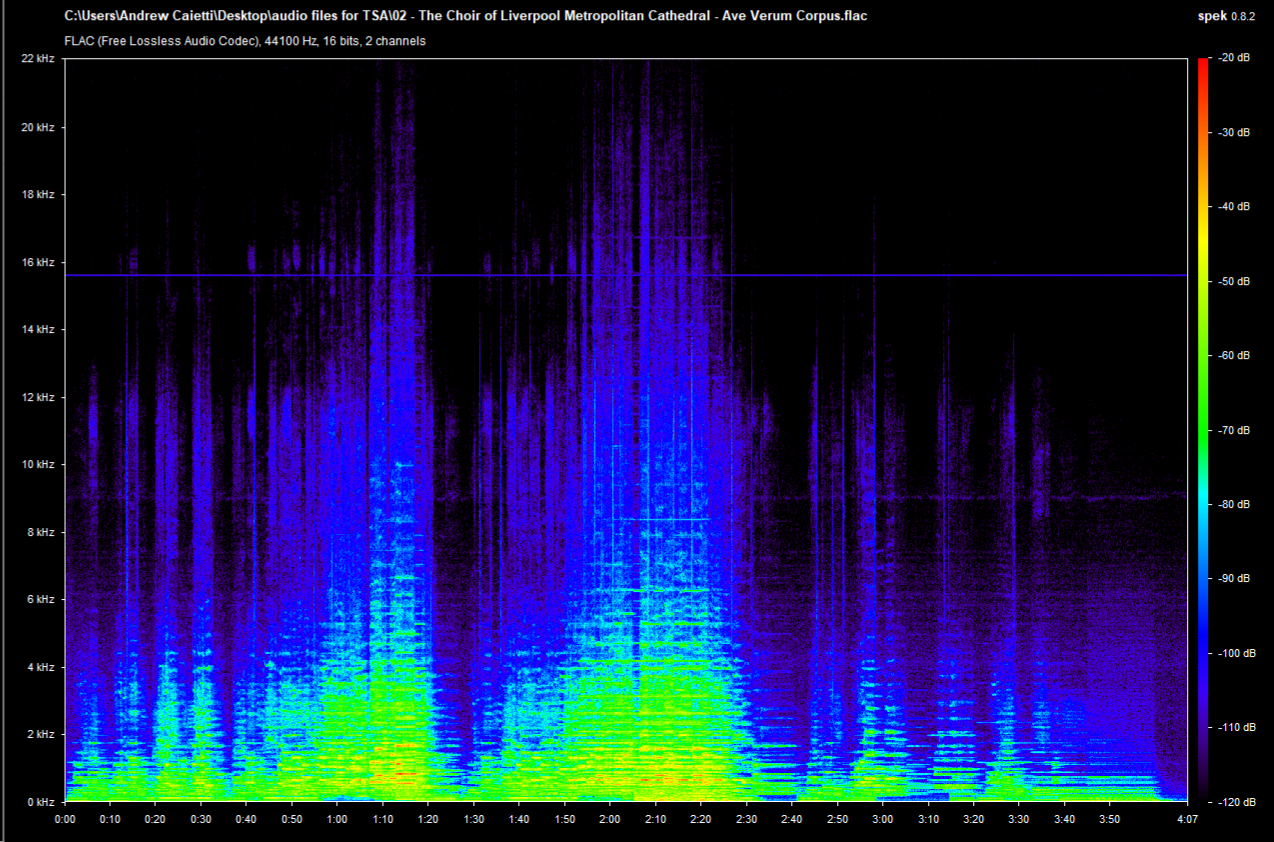
Music Frequency Analysis
A frequency exploration of songs from 1791, 1976, and 2021. Spectrographic analysis is done to see the differences between these three eras and genres.
El Nino/La Nina Time Series Analysis
An exploration of how the El Nino Southern Oscillation (ENSO) can have public health implications globally, with analysis done using spectral density, periodograms, and autocorrelation function plots.